

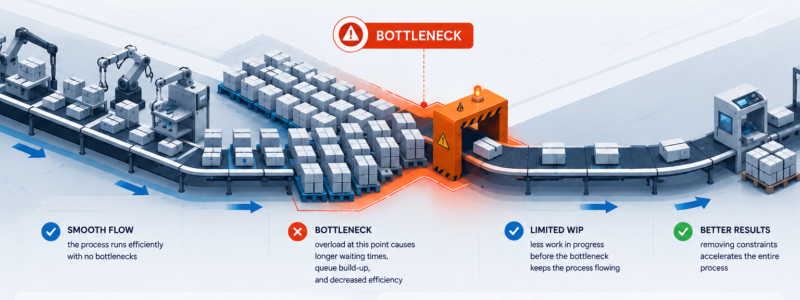
Are bottlenecks the result of a slow machine or overworked operators? Or are they the result of limited information flow? Or perhaps a bit of both? In this column, we’ll explore the development, identification, and elimination of bottlenecks in production processes.
Imagine a company manufacturing printed circuit boards (PCBs) where manual soldering operations consistently cause delays. Attempting to add another soldering station (parallelization) is only worthwhile if sufficient personnel and material supply are available.
A cost-effective way to increase productivity could be a robotic soldering station (station automation), but usually with the assumption of high production volume. The robot operates with a predictable cycle and requires no rest breaks, significantly increasing repeatability and throughput compared to a human operator.
Alternatively, if the station is critical and there’s no room for expansion, a solution might be to add buffers between the soldering iron and the previous stage (e.g., flow soldering) and between the soldering iron and the next stage (e.g., testing). This protects the bottleneck from disruptions in part supply and equipment failures.
What are bottlenecks and how do they hinder production?
Bottlenecks are locations, processes, machines, or production stations that slow down the entire production process due to their limited capacity. These bottlenecks determine the maximum throughput of the line and influence the speed of order fulfillment.
The occurrence of bottlenecks in production leads to downtime, the formation of queues of semi-finished products, extended production times, decreased utilization of other resources, and increased operating costs. As a result, the company produces less, slower, and less efficiently, negatively impacting on-time delivery, quality, and profitability.
Contexts, contexts and more contexts
At NEOTECH, the design, construction, and operation of production automation, assembly, inspection, and packaging machines and lines are a daily occurrence. In this context, bottlenecks can arise both at physical stations (e.g., slow testing machines, manual assembly lines) and in the flow of information (planning delays, downtime due to parts shortages). Therefore, every decision to invest in automation or modernization requires an analysis of where the constraints (throughput) exist and which solutions will deliver the greatest efficiency gains.
For engineers and production managers, it’s crucial to understand that a production system’s performance is limited by its weakest link. According to the Theory of Constraints (TOC), even the most advanced investment anywhere in the line won’t improve overall productivity unless this bottleneck is removed. Therefore, instead of focusing on local improvements, a holistic view of the flow is essential, including process mapping and continuous monitoring of where delays occur—the so-called “Work-In-Progress” (WIP) queues—before individual operations.
A model process for identifying and eliminating bottlenecks. General concept:

A little bit of theory - Methods for identifying bottlenecks
At this point, it’s worth emphasizing that in practice, bottlenecks “escape”—they change over time depending on orders, corrective actions, failures, and even crew competencies! Therefore, monitoring and identification must be a continuous process. How can this be accomplished? Below are the seven most popular methods:
A graphical representation of the entire value stream from raw material to finished product. VSM allows you to visually pinpoint areas with high inter-operational inventory or longest-running operations, which may indicate bottlenecks. For example, a diagram drawing “dense” lanes at a specific station may suggest that it is slowing down the entire line.
In short, it’s an analysis of the cycle times of each station. If the cycle time of one operation significantly exceeds another (e.g., 45 seconds vs. 30 seconds), the slower operation almost always becomes the bottleneck. Takt time measurement (the metric “it takes X seconds to produce 1 unit”) highlights inconsistencies. Common tools, such as recording the number of products per unit of time or plan-to-execute analyses, can quickly uncover downtime related to individual machines or operators.
Measurement of inter-operational inventory. Slow operations accumulate semi-finished products in front of them. Large queues indicate a bottleneck. During the design phase, a Gantt report or schedule simulation (e.g., in APS systems) can be used, where abnormally long queues for a single operation indicate overload. WIP measurement can also be automated, with weight sensors or video cameras recording accumulated workpieces.
Regular monitoring of machine and workstation efficiency. Declining OEE at a single station (due to frequent breakdowns, long changeover times, or slower cycle times) immediately indicates a potential limitation. In practice, utilization and actual machine operating time are analyzed, looking for deviations from the norm.
Analyzing production reports and events. Unfortunately, reports often only show effects, not causes – this means you need to be vigilant and look for these very causes! It’s worth asking: where and when does a delay first occur? Which activity most often initiates downtime? A classic identification checklist includes: Where do queues form? Which department or operation operates continuously the longest? Does the report show recurring failures or priorities? – As practice shows, “blind” optimization in small steps often fails to address the root of the problem. Therefore, each signal (e.g., operators’ statements “We’re waiting for delivery,” “The machine is down, the operator is waiting,” etc.) should be linked to data measurements in the system and actual production observations. Lean/Kaizen audits (SMED, TPM) can also be helpful, focusing on eliminating waste (e.g., changeover times, material location).
Manufacturing process modeling in an MES/ERP environment can highlight bottlenecks in “what-if” scenarios. Advanced Planning and Scheduling (APS) tools automatically identify resource conflicts and bottlenecks, showing, for example, that one line will be overloaded after a given order is completed. Flow simulation allows for the evaluation of various order and inventory allocation options, minimizing inventory before and after potential bottlenecks.
SCADA, IoT, and MES systems are used for identification, collecting real-time data. NeoTAGs, barcode scanners, flow sensors, in-line scales, and industrial vision cameras record production rates and the locations of any downtime. Factory intelligence solutions (e.g., prediction systems and AI) are also becoming increasingly popular, alerting when metrics (uptime, takt) fall below thresholds. Identifying bottlenecks starts with data—in practice, the question should be, “Where does the machine operate 100% of the time before it detects any downtime?”

Tools for process monitoring
ERP / MES / APS systems
ERP platforms (e.g., with MRP / MES modules) continuously record order fulfillment, cycle times, and inventory levels. Data integration allows for the quick extraction of KPIs (Key Performance Indicators) such as OEE, Throughput, and WIP, and the tracking of their trends.
APS systems generate optimal schedules that take into account resource constraints and prepare simulations that the planner can analyze for production conflicts.
WARNING – systems cannot be completely trusted! Any automation should be analyzed by a human, as the system may have incomplete input data – for example, it may not be aware of planned machine maintenance, the absence of trained employees, or unplannable delivery delays caused by, for example, deteriorating weather conditions.
SCADA and IoT systems
Automatic data collection from machines (batch counters, cycle counters, ON/OFF status sensors, vibration sensors, scales, energy telemetry, etc.) enables accurate OEE calculations and immediate detection of production bottlenecks. For example, integrated thermal imaging cameras or control sensors can instantly detect process speed drops—or product quality deterioration without compromising productivity. Measuring tool manufacturers often emphasize that analyzing cycle time, number of pieces per hour, machine availability, micro-downtime, and employee workload are key to diagnosing bottlenecks.
Measurement Checklist -
Questions to help identify the bottleneck:
1. Where does the most inter-operational inventory accumulate?
2. Which machine runs the longest without interruption/downtime?
3. Which workstation is waiting for production due to delays?
4. Where do rapid changes in priorities most frequently occur?
5. Which operations have the lowest efficiency (OEE <80%)?
6. Do the cycle times of individual process steps differ significantly?
Elimination methods and comparison of solutions
Once a bottleneck is identified, the goal is to increase the capacity of that bottleneck or its surroundings so that the entire system can operate more efficiently. In practice, various strategies are used, including both organizational changes and hardware investments. The following table compares the main techniques for eliminating production constraints:
| METHOD | OPERATION DESCRIPTION | BENEFITS | CHALLENGES / COSTS |
| METHODE | FUNKTIONSBESCHREIBUNG | VORTEILE | HERAUSFORDERUNGEN / KOSTEN |
Line Balancing Linienausgleich | Synchronize production stages. Equalize cycle times across all stations (equal work cycle). Redirect some work from downtime (redistribution). Synchronisierung der Produktionsstufen. Angleichung der Zykluszeiten an allen Stationen (gleicher Arbeitszyklus). Umverteilung von Arbeitslasten während Stillstandszeiten. | Eliminates production spikes and reduces downtime. Simple to implement organizationally. Beseitigung von Produktionsspitzen und Reduzierung von Stillstandszeiten. Einfache organisatorische Umsetzung. | Time-consuming planning. Requires flexible resources. Physically limited effect. Zeitaufwändige Planung. Erfordert flexible Ressourcen. Begrenzte physische Wirkung. |
Buffering (Collective) Pufferbildung (kollektiv) | Creating a buffer stock before the bottleneck. The buffer protects critical resources. Aufbau eines Pufferbestands vor dem Engpass. Der Puffer schützt kritische Ressourcen. | Protects against downtime by accumulating semi-finished products. Allows for continuous station operation during temporary disruptions. Schutz vor Stillstandszeiten durch die Ansammlung von Halbfertigprodukten. Ermöglicht den kontinuierlichen Stationsbetrieb bei vorübergehenden Störungen. | Increases inventory, locks in capital. Requires precise flow control and storage locations. Erhöht den Lagerbestand, bindet Kapital. Erfordert präzise Flusssteuerung und Lagerorte. |
Parallelization Parallelisierung | Adding parallel resources to the bottleneck (e.g., a second machine, several parallel lines). Hinzufügen paralleler Ressourcen am Engpass (z. B. eine zweite Maschine, mehrere parallele Linien). | Doubling / multiplying processing power. Flexibility in handling various product variants. Verdopplung / Vervielfachung der Verarbeitungsleistung. Flexibilität bei der Handhabung verschiedener Produktvarianten. | High capital investment. Risk of shifting the bottleneck further. Hoher Kapitalaufwand. Risiko einer weiteren Verlagerung des Engpasses. |
Automation / Robotization Automatisierung / Robotik | Introducing automated stations where the bottleneck lies in manual or slow operations. Einführung automatisierter Stationen, wo der Engpass in manuellen oder langsamen Arbeitsgängen liegt. | Significant increase in throughput (constant cycle time, fatigue-free operation). Improved quality by eliminating human errors. Deutliche Steigerung des Durchsatzes (konstante Zykluszeit, ermüdungsfreies Arbeiten). Verbesserte Qualität durch Vermeidung menschlicher Fehler. | ROI depends on production scale. High investment costs. Requires integration with existing lines. Der ROI ist abhängig vom Produktionsumfang. Hohe Investitionskosten. Erfordert die Integration in bestehende Linien. |
Predictive Maintenance Vorausschauende Wartung | Preventive and predictive maintenance reduces unexpected failures. Präventive und vorausschauende Wartung reduziert unerwartete Ausfälle. | Reduction in unplanned downtime on critical resources. More stable machine operation. Reduzierung ungeplanter Stillstandszeiten kritischer Ressourcen. Stabilerer Maschinenbetrieb. | Costs of implementing sensors and software. Does not remove the physical limitation, but minimizes the risk of it becoming more difficult. Kosten für die Implementierung von Sensoren und Software. Beseitigt nicht die physische Begrenzung, minimiert aber das Risiko einer Verschärfung. |
Changing the line layout Änderung des Linienlayouts | Reconfiguring the station layout (shortens distances within the factory). Optimization of internal logistics. Neukonfiguration des Stationslayouts (Verkürzung der Wege innerhalb der Fabrik). Optimierung der internen Logistik. | Reduced transport times, better production synchronization with actual efficiency. Low costs with maximum impact. Reduzierte Transportzeiten, bessere Produktionssynchronisation mit der tatsächlichen Effizienz. Geringe Kosten bei maximaler Wirkung. | May require a production interruption. Limited impact if caused by equipment or staffing issues. Kann eine Produktionsunterbrechung erfordern. Begrenzte Auswirkungen bei Ursachen durch Geräte- oder Personalprobleme. |

Each method has different costs and returns on investment (ROI). For example, automation delivers a significant increase in throughput (and often improves quality) compared to manual work, but requires significant capital expenditure. It often pays off in the long run and with high volume. Changing a hall layout or optimizing transport routes can be relatively inexpensive (often a one-time measure) and provides an immediate increase in capacity. The choice of solution should be based on a cost-benefit analysis.
In the context of the selection criteria, it’s worth considering:
- Scalability – will the solution solve only a one-time order, or will it permanently increase throughput?
- Implementation time – are immediate effects more important than, for example, the ROI after several years (automation vs. “Lean” improvements)?
- Risks and limitations – Will one new robot create a new bottleneck? We need to consider the domino effect – removing one limitation will almost always result in another. More on this below.
Costs and Return on Investment (ROI)
An ROI assessment for bottleneck removal investments should consider reduced production costs (fewer delays, less overtime, less inventory in progress), increased productivity, and increased revenues due to improved on-time performance.
For example, analysis of companies using the Theory of Constraints showed a 20–50% increase in productivity without additional investment! In practice, companies often create a financial model comparing various scenarios—for example, the cost of a new robot versus the cost of lost production units. The literature emphasizes that the increase in production after eliminating a barrier should exceed the project costs within a reasonable timeframe (e.g., ROI < 2–3 years). Examples of savings include: a reduction in downtime (often >20–30% after implementing predictive maintenance or new planning), a reduction in work-in-progress inventory (freeing up capital), a reduction in errors and scrap (improved quality), and the avoidance of penalties for late delivery.
The hidden costs of risk should also be considered, especially the transfer of problems to other areas. Increasing the efficiency of one station shifts the bottleneck elsewhere and can cause the next operation (push) or the previous operation (pull) to become overloaded. Therefore, ROI is often assessed in stages and with repeated iterations – after removing one constraint, the process must be “restarted”!

Summary
Bottlenecks are an inevitable element of any production system, but their conscious management—from detailed identification to selective elimination—can significantly improve the efficiency of the entire production line. Poorly resolved bottlenecks can spread problems and carry hidden costs.
Our analysis and experience demonstrate that an iterative approach is key:
MEASUREMENT → ANALYSIS → STRATEGY → VERIFICATION
Using proven methods (Lean, TOC) with modern tools (MES / ERP, IoT, AI) brings tangible benefits, but requires a flexible approach and an awareness of the risk of bottlenecks shifting.
